
Before you wire into a private fund, know the spectrum. From 0.01% savings to 24% tax liens, capital lives on a risk ladder. At Overlap Capital, we publish alternatives first—because disciplined investors deserve context before commitment.
The 2026 Investing Index: Why We Show You the Alternatives Before We Show You the Fund
Before we ask an investor to allocate capital into a 506(b), 506(c), or Reg CF offering, we walk them through something most sponsors skip: the alternatives. From insured savings accounts at 0.01–0.50% to tax lien strategies targeting 18–24%, capital lives on a spectrum. At Overlap Capital, we publish that spectrum first—because informed capital compounds better than rushed capital.
As a fund manager with nearly fifteen years in capital structuring, underwriting, and investor relations, I have learned that the most sophisticated allocators are not the ones chasing the highest percentage. They are the ones who understand the baseline. When we began expanding into more Regulation D and Regulation Crowdfunding structures, working with former athletes, family offices, and first-time private investors alike, we made a decision: due diligence conversations would begin with context, not pitch decks.
This is the foundation of our 2026 Investing Index.
Capital Lives on a Risk Continuum
Most investment conversations begin with the question, “What’s the return?” The more disciplined question is, “What is the alternative?”
In 2026, the capital spectrum looks something like this:
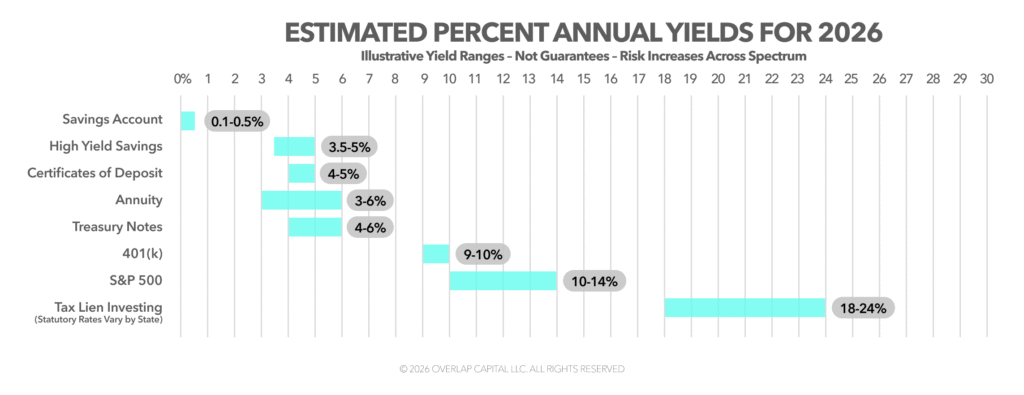
Savings accounts generally range from 0.01–0.50% depending on the institution and rate environment. These are FDIC-insured vehicles designed for liquidity, not growth.
Certificates of deposit are currently yielding approximately 4–5% depending on duration and issuer. They offer incremental yield in exchange for temporary capital lockup.
High-yield savings accounts have been paying in the range of 3.5–5% depending on the rate cycle. Again, the tradeoff is limited upside but strong liquidity.
Treasury notes issued by the U.S. Department of the Treasury have recently yielded approximately 4–6% depending on maturity. These are widely used as the benchmark “risk-free rate” in financial modeling.
Fixed annuities may credit returns in the range of 3–6%, often sacrificing liquidity for contractual stability.
A 401(k) is a tax wrapper rather than a return profile, but when invested in diversified equity exposure, long-term historical returns for U.S. equities have averaged approximately 9–10% annually over extended periods.
Broad public equity exposure, such as the S&P 500, has historically delivered long-term nominal returns in the range of roughly 10–14% depending on the period measured, though volatility is significant year-to-year.
Tax lien investing in certain jurisdictions may advertise statutory rates between 18–24%, though realized returns vary based on auction competition, redemption timing, and legal structure.
These instruments exist independently of our funds. They are accessible. They are legitimate. And they form the context in which any private offering must be evaluated.
Why We Publish Alternatives First
When investors allocate capital into a private vehicle structured under Regulation D or Regulation Crowdfunding, they are accepting illiquidity, execution risk, and manager dependency in exchange for a potential premium over public benchmarks.
The key word is premium.
If Treasury notes yield 4–6%, any private strategy targeting 12% must justify that additional 6–8% spread. If public equities have historically returned 9–10% over long periods, a private vehicle targeting 15–18% must articulate the structural drivers behind that excess return.
That conversation is rarely held with clarity.
Warren Buffett summarized the discipline required in his 2023 Berkshire Hathaway shareholder letter: “Risk comes from not knowing what you are doing.” The letter can be accessed at https://www.berkshirehathaway.com/letters/2022ltr.pdf. The insight is simple but operationally demanding. Knowing what you are doing means understanding opportunity cost. It means comparing every allocation against what else that dollar could be doing.
At Overlap Capital, we respect that process. Publishing our 2026 Investing Index is not a defensive maneuver. It is a governance posture. We want investors to know there are lower-risk ways to deploy capital. We want them to understand liquidity tradeoffs. We want them to evaluate spreads consciously.
Because disciplined investors become long-term partners.
The Illiquidity Premium and Fiduciary Responsibility
Small business advocates and entrepreneurs frequently act as fiduciaries for their companies. Retained earnings, investor proceeds, and excess cash flow are not personal hobby funds. They represent stakeholder trust.
Liquidity has value.
An entrepreneur allocating working capital into a five-year illiquid private structure must weigh not only target return but operational flexibility. During economic contractions, liquidity becomes an asset class of its own.
The 2024 Global Retail Investor Outlook conducted by the World Economic Forum in collaboration with BNY Mellon found that nearly half of surveyed retail investors globally lack confidence in their understanding of financial markets. Access to private capital markets has expanded dramatically, but literacy has not kept pace.
This gap increases the responsibility of fund managers.
Rather than relying on performance narratives alone, we structure onboarding communications to include alternatives early and often. We distribute educational materials outlining Treasury benchmarks, public equity volatility, and structured product tradeoffs. We encourage investors to allocate proportionally rather than concentrically.
Capital discipline is not built in the closing call. It is built in the comparison phase.
Tax Liens and the Allure of Headline Yield
One of the most misunderstood segments on the risk ladder is tax lien investing. In certain states, statutory rates may reach 18–24%. That headline yield attracts attention.
However, realized returns depend on redemption behavior, auction bidding dynamics, property quality, and legal timelines. Competition often compresses effective yields. Capital can be tied up longer than expected. Legal expenses may erode margins.
The point is not to discourage sophisticated alternatives. It is to contextualize them.
An 18% target without execution nuance is marketing. An 18% strategy supported by legal process understanding and jurisdictional analysis is investing.
We teach the difference.
From Capital Raising to Capital Readiness
Overlap Capital’s mission has always centered on capital readiness. That means preparing businesses not only to raise funds, but to steward them intelligently.
The 2026 Investing Index is an extension of that philosophy. It forces us, as sponsors, to evaluate our own offerings against public baselines. It forces investors to ask better questions. It elevates the discourse beyond yield and into allocation architecture.
Savings accounts serve liquidity. CDs and Treasuries anchor safety. Public equities drive long-term growth. Insurance instruments moderate volatility. Specialized strategies capture niche premiums. Private funds integrate operational leverage and structured opportunity.
No single tier is inherently superior. Each plays a role within a capital system.
Respecting Wealth Requires Context
The most valuable paragraph in this entire framework is the first one investors encounter: before committing capital to our fund, understand the alternatives. That sentence reframes the relationship.
We are not asking for blind conviction. We are asking for informed conviction.
When we publish our 2026 Investing Index, we are signaling that we welcome comparison. We are confident enough in our underwriting discipline to invite scrutiny against Treasury yields and public benchmarks. We believe that a properly structured private vehicle can justify its premium—but only within a diversified architecture.
Investing is not a contest of percentages. It is a process of calibration.
In 2026, the most disciplined investors will not be those chasing the highest number on a slide deck. They will be those who understand where that number sits relative to 0.01% liquidity, 4–6% government benchmarks, 9–10% long-term equity averages, and 18–24% niche statutory opportunities.
At Overlap Capital, we intend to keep that spectrum visible.
Because wealth is not built by ignoring alternatives. It is built by understanding them, respecting them, and allocating accordingly.